7 Comparative Financial Analysis
8 Introduction
Here we compare financial performance of United Airlines (UAL), JetBlue (JBLU), and SkyWest (SKW). This report provides a detailed comparative financial analysis of three distinct players in the U.S. airline industry: legacy carrier United Airlines (UAL), low-cost carrier JetBlue (JBLU), and regional operator SkyWest (SKW). Utilizing financial data from the beginning of 2020 through the end of fiscal year 2024, this study examines the post-pandemic recovery, financial health, profitability, and operational efficiency of each company. The strategic importance of this analysis lies in understanding the divergent recovery paths and competitive positioning that have emerged in a sector profoundly reshaped by recent global events.
8.1 Leverage Ratios
The leverage ratios analyzed include Debt-to-Asset and Debt-to-Equity ratios.
The Debt-to-Asset ratio measures the proportion of a company’s assets that are financed through debt, indicating the level of financial risk. A higher ratio suggests greater reliance on debt financing, which can increase vulnerability to economic downturns.
The Debt-to-Equity ratio compares a company’s total debt to its shareholders’ equity, providing insights into the company’s capital structure and financial leverage. A higher Debt-to-Equity ratio indicates that a company is using more debt relative to equity to finance its operations, which can amplify returns but also increases financial risk.
In the charts below, we analyze the Debt-to-Asset and Debt-to-Equity ratios for United Airlines (UAL), JetBlue (JBLU), and SkyWest (SKW) from the fourth quarter of 2019 to the second quarter of 2025. We observe how these airlines have managed their debt levels in response to industry challenges, particularly in the context of the COVID-19 pandemic and its aftermath.
SkyWest (SKW) consistently maintains lower leverage ratios compared to UAL and JBLU, indicating a more conservative approach to debt financing.
JetBlue (JBLU) shows a gradual increase in leverage ratios, reflecting its growth strategies post-pandemic.
United Airlines (UAL) exhibits fluctuations in leverage ratios, highlighting efforts to balance debt management with operational needs during recovery phases.
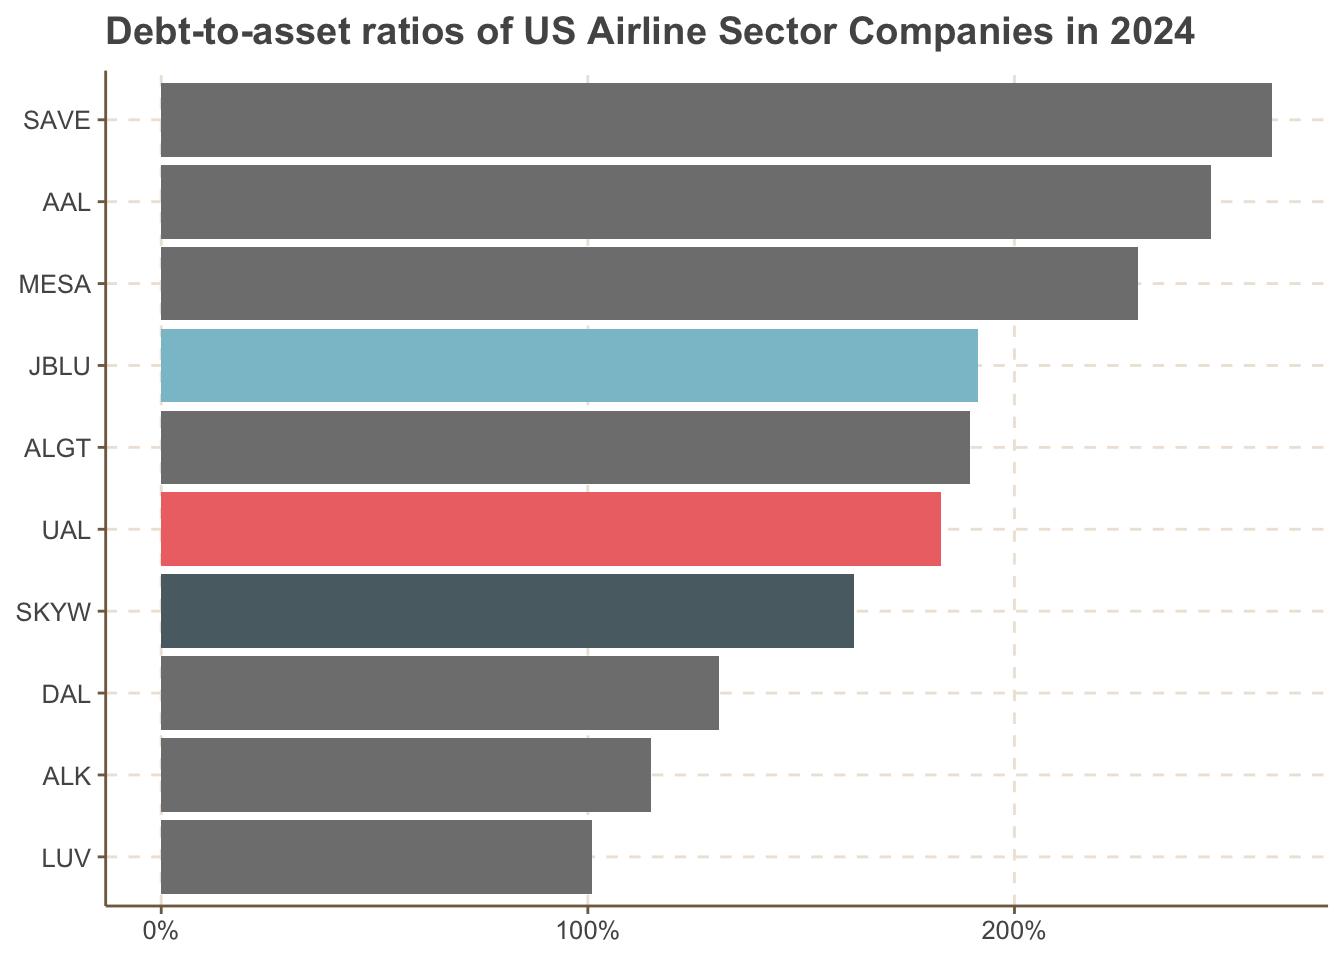
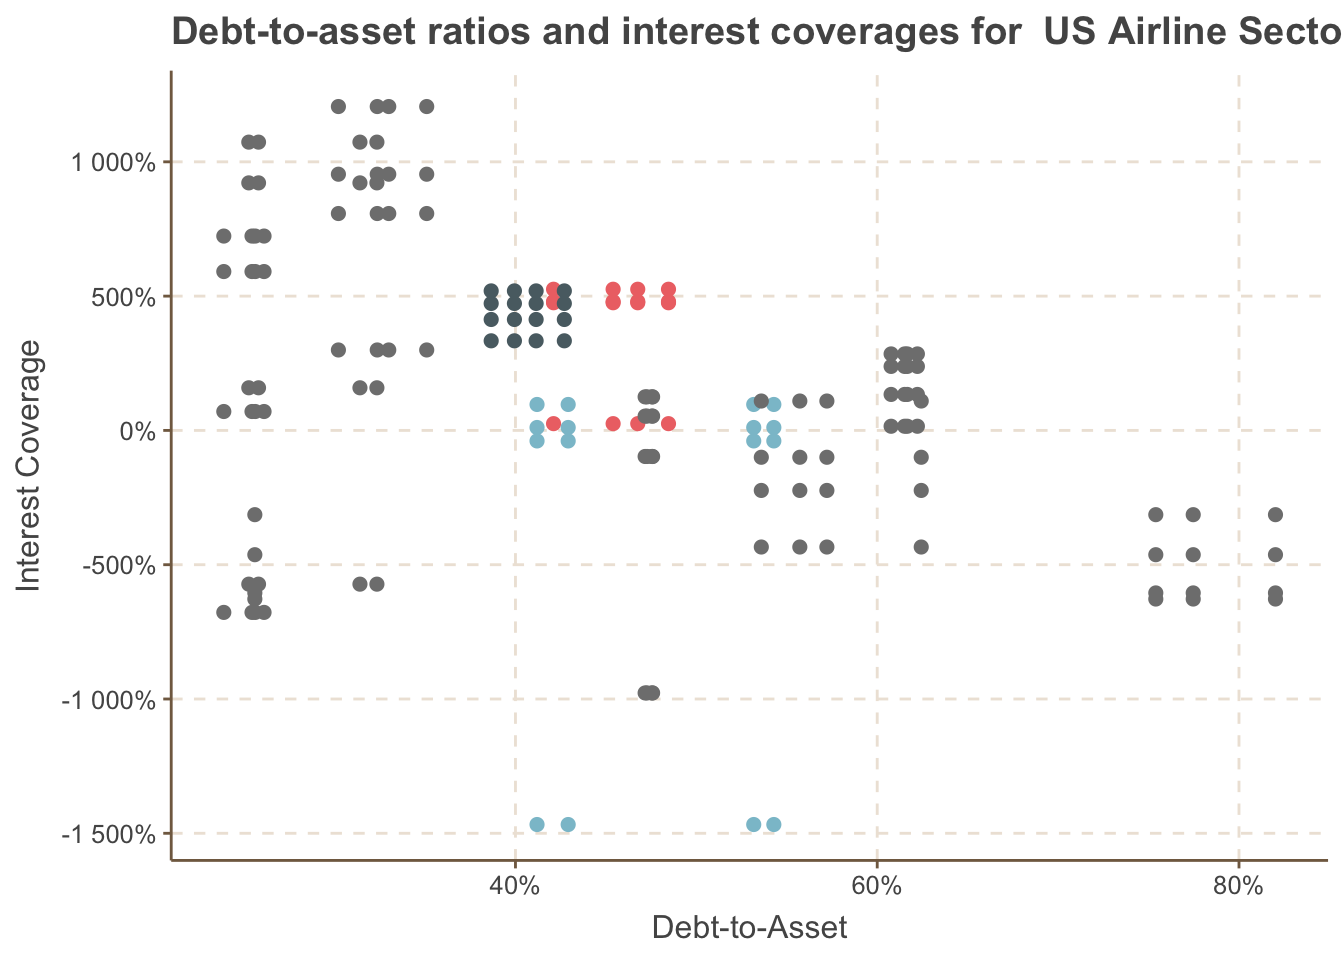
8.2 Cross-Sectional Analysis of Debt to Asset Ratio in 2024
8.3 Efficiency and Profitability Ratios
8.3.1 Return on Assets and Return on Equity
The return on assets (ROA) and return on equity (ROE) ratios are key indicators of a company’s profitability and efficiency in utilizing its assets and equity to generate earnings.
ROA measures how effectively a company uses its assets to produce net income, while ROE assesses the profitability relative to shareholders’ equity.
In the charts below, we analyze the ROA and ROE trends for United Airlines (UAL), JetBlue (JBLU), and SkyWest (SKW) from the fourth quarter of 2019 to the second quarter of 2025. We observe how these airlines have navigated the challenges of the airline industry, particularly in the context of the COVID-19 pandemic and its aftermath.
SkyWest (SKW) consistently demonstrates higher ROA and ROE compared to UAL and JBLU, indicating a more efficient use of assets and equity in generating profits.
JetBlue (JBLU) shows a gradual improvement in both ROA and ROE, reflecting its recovery and growth strategies post-pandemic.
United Airlines (UAL), while showing fluctuations, indicates efforts to stabilize and enhance profitability through various operational adjustments.
8.3.2 Capital Structure Leverage and Common Earnings Leverage
The capital structure leverage ratio and common earnings leverage ratio are important metrics for assessing a company’s financial leverage and risk profile.
The capital structure leverage ratio indicates the extent to which a company utilizes debt in its capital structure, while the common earnings leverage ratio measures the sensitivity of a company’s earnings to changes in its operating income.
In the charts below, we analyze these leverage ratios for United Airlines (UAL), JetBlue (JBLU), and SkyWest (SKW) from the fourth quarter of 2019 to the second quarter of 2025. We observe how these airlines have managed their financial leverage in response to industry challenges, particularly in the context of the COVID-19 pandemic and its aftermath. S
SkyWest (SKW) consistently maintains lower leverage ratios compared to UAL and JBLU, indicating a more conservative approach to debt financing.
JetBlue (JBLU) shows a gradual increase in leverage ratios, reflecting its growth strategies post-pandemic.
United Airlines (UAL) exhibits fluctuations in leverage ratios, highlighting efforts to balance debt management with operational needs during recovery phases.
8.3.3 Efficiency Ratios Over Time
The efficiency ratios analyzed include Asset Turnover, Inventory Turnover, and Receivables Turnover. Asset Turnover measures how effectively a company utilizes its assets to generate revenue.
Inventory Turnover assesses how efficiently inventory is managed and sold, while Receivables Turnover evaluates the effectiveness of credit and collection policies. These ratios provide insights into operational efficiency and resource management.
In the charts below, we analyze these efficiency ratios for United Airlines (UAL), JetBlue (JBLU), and SkyWest (SKW) from the fourth quarter of 2019 to the second quarter of 2025. We observe how these airlines have optimized their operations in response to industry challenges, particularly in the context of the COVID-19 pandemic and its aftermath.
SkyWest (SKW) consistently demonstrates higher efficiency ratios compared to UAL and JBLU, indicating more effective asset and resource management.
JetBlue (JBLU) shows improvements in efficiency ratios, reflecting its recovery and growth strategies post-pandemic.
United Airlines (UAL) exhibits fluctuations in efficiency ratios, highlighting efforts to enhance operational performance during recovery phases.
8.3.4 Profitability Ratios Over Time
The profitability ratios analyzed include Gross Margin, Profit Margin, and After-Tax Return on Equity (ROE).
Gross Margin indicates the percentage of revenue that exceeds the cost of goods sold, reflecting the efficiency of production and pricing strategies.
Profit Margin measures the overall profitability by showing the percentage of revenue that remains as profit after all expenses, taxes, and costs have been deducted.
After-Tax ROE assesses how effectively a company generates profit from its shareholders’ equity after accounting for taxes, providing insight into financial performance and shareholder value creation.
These ratios are crucial for evaluating the financial health and operational efficiency of companies. In the charts below, we analyze these profitability ratios for United Airlines (UAL), JetBlue (JBLU), and SkyWest (SKW) from the fourth quarter of 2019 to the second quarter of 2025. We observe how these airlines have managed their profitability in response to industry challenges, particularly in the context of the COVID-19 pandemic and its aftermath.
SkyWest (SKW) consistently demonstrates higher profitability ratios compared to UAL and JBLU, indicating more effective cost management and revenue generation.
JetBlue (JBLU) shows improvements in profitability ratios, reflecting its recovery and growth strategies post-pandemic.
United Airlines (UAL) exhibits fluctuations in profitability ratios, highlighting efforts to enhance financial performance during recovery phases.
8.4 Common Size Analysis - Income Statement
The common-size analysis standardizes financial statements by expressing each line item as a percentage of a base figure, allowing for easier comparison across companies and time periods.
In the income statement, each item is expressed as a percentage of total revenue. The net income ratio, gross profit ratio, and operating income ratio are key metrics derived from this analysis.
The net income ratio indicates the percentage of revenue that remains as profit after all expenses, taxes, and costs have been deducted. A higher net income ratio suggests better profitability and efficiency in managing expenses relative to revenue.
The gross profit ratio reflects the percentage of revenue remaining after accounting for the cost of goods sold, indicating how efficiently a company produces and sells its products.
The operating income ratio shows the percentage of revenue left after covering operating expenses, providing insight into the company’s operational efficiency.
By analyzing these ratios over time and across different airlines, stakeholders can assess financial health, operational performance, and profitability trends within the airline industry.
Net Income Ratio for UAL, JBLU and SKYW (2019 Q4 - 2025 Q2)
Expense Composition for UAL, JBLU and SKYW (2023 Q4)
Margin Comparison for UAL, JBLU and SKYW (2019 Q4 - 2025 Q2)
8.5 Common Size Analysis - Balance Sheet
The common-size analysis of the balance sheet provides insights into a company’s financial structure by expressing each line item as a percentage of total assets. This standardization allows for easier comparison across companies and time periods.
The capital structure, asset composition, and liquidity ratios are key components of this analysis. The capital structure illustrates the proportion of liabilities, equity, and cash in relation to total assets, highlighting how a company finances its operations.
The asset composition reveals the distribution of different asset types, such as cash, property, and intangible assets, providing insights into resource allocation.
By analyzing these ratios over time and across different airlines, stakeholders can assess financial health, operational efficiency, and strategic positioning within the airline industry.
Capital Structure for UAL, JBLU and SKYW (2019 Q4 - 2025 Q2)
Asset Composition for UAL, JBLU and SKYW (2019 Q4 - 2025 Q2)
8.6 Common Size Analysis - Cash Flow Statement
The cash flow statement common size analysis provides insights into how effectively a company generates cash from its operations, invests in assets, and finances its activities.
The Cash Flow Quality, Cash Flow Composition, and Free Cash Flow ratios are key indicators of financial health and operational efficiency.
The Cash Flow Quality ratio measures the proportion of net income that is supported by cash flow from operations.
The Cash Flow Composition chart illustrates the proportion of cash flows from operating, investing, and financing activities as a percentage of total cash inflows.
Free Cash Flow indicates the cash available after capital expenditures, which is crucial for growth and shareholder returns.
Cash Flow Quality for UAL, JBLU and SKYW (2019 Q4 - 2025 Q2)
Cash Flow Composition for UAL, JBLU and SKYW (2019 Q4 - 2025 Q2)
Free Cash Flow for UAL, JBLU and SKYW (2019 Q4 - 2025 Q2)
8.7 Net Income Ratio by year and airline
The heatmap below visualizes the average Net Income Ratio for each airline across different years, providing insights into their profitability trends over time.
Net Income Ratio by Year and Airline (2019 - 2024)
8.8 Bankruptcy Prediction Model
8.8.1 Altman Z-Score for Service Industry Over Time
The Altman Z-Score is a widely used metric for predicting the likelihood of bankruptcy. A score above 2.6 indicates a low risk of bankruptcy, while a score below 1.1 suggests a high risk. Between these values lies a gray area where the risk is moderate.
Below is the Altman Z-Score for the service industry, specifically for United Airlines (UAL), JetBlue (JBLU), and SkyWest (SKW) from the fourth quarter of 2019 to the second quarter of 2025. We observe that UAL and JBLU have scores fluctuating in the high risk zone, while SKW consistently maintains a score above 1.1, indicating a moderate risk of bankruptcy.
Altman Z-Score - Service Industry for for UAL, JBLU and SKYW (2019 Q4 - 2025 Q2)
8.9 Operating Leverage Ratios
8.9.1 Operating Leverage Over Time
These ratios help assess how efficiently a company utilizes its fixed assets and working capital to generate revenue.
The operating leverage ratio indicates the sensitivity of operating income to changes in sales revenue.
Fixed asset turnover measures how effectively a company uses its fixed assets to generate sales, while working capital turnover evaluates how efficiently a company utilizes its working capital to support sales.
Working capital is calculated as current assets minus current liabilities.
Below charts illustrate these ratios for United Airlines (UAL), JetBlue (JBLU), and SkyWest (SKW) from the fourth quarter of 2019 to the second quarter of 2025.
We observe that SkyWest (SKW) consistently demonstrates higher efficiency in utilizing its fixed assets and working capital compared to UAL and JBLU, indicating more effective resource management.