United Airlines (UAL) Historical Market Capitalization (2020-2024)
4 United Airlines (UAL) Financial Analysis
As a premier global legacy carrier, United Airlines’ financial performance serves as a crucial barometer for the health of the entire airline industry. Its vast network and exposure to international and business travel make its recovery from the 2020 downturn a key case study in sector resilience. This section performs a time-series analysis of UAL’s profitability, financial health, and cash flow sustainability from 2020 through the end of fiscal year 2024.
4.1 Market Capitalization Recovery
United’s market capitalization trajectory mirrors the broader industry’s rollercoaster ride through the pandemic. The precipitous drop in early 2020 reflects the immediate shock to air travel demand, while the subsequent recovery highlights investor confidence in UAL’s strategic initiatives and the overall rebound of the airline sector.
4.2 Income Sustainability and Recovery
4.2.1 Profitability Analysis
United’s income statement reflects a dramatic V-shaped recovery. After a staggering loss in 2020, the airline saw revenues climb aggressively, surpassing pre-pandemic levels by 2023. This top-line momentum translated into a powerful return to profitability.
United Airlines (UAL) Quarterly Revenue and Net Income (2020-2024)
4.2.2 Margin Analysis
The operating margin collapse to -62.6% in 2020 quantifies the devastating impact of the pandemic on UAL’s core operations. The recovery was swift; by 2022, UAL had achieved a strong 11.1% operating margin and positive net income. The return to double-digit operating margins in 2024 underscores the success of its strategy to focus on premium, international, and business travel, which command higher yields and have seen robust post-pandemic demand.
United Airlines (UAL) Quarterly Operating and Net Margins (2020-2024)
4.3 Balance Sheet Health and Leverage
UAL’s balance sheet underwent significant stress and subsequent repair during this period. The company took on substantial debt to navigate the pandemic, but has since focused on de-leveraging.
United Airlines (UAL) Quarterly Total Assets, Debt and Equity (2020-2024)
4.3.1 Debt-to-Equity Ratio Trend
The evolution of UAL’s capital structure is stark. The Debt-to-Equity ratio (Total Liabilities / Total Equity) peaked in 2022 at over 18, indicating extreme financial risk. However, driven by retained earnings, the equity base has more than doubled from its 2021 low, and the Debt-to-Equity ratio has been systematically reduced to a more manageable, though still high, 4.7 by year-start 2025. This trend of strengthening the balance sheet is a critical component of its long-term strategy.
United Airlines (UAL) Quarterly Debt-to-Equity Ratio (2020-2024)
4.4 Cash Flow Quality and Sustainability
A key measure of an airline’s health is its ability to generate cash internally. The comparison between Net Income and Cash from Operating Activities (CFO) reveals the quality of UAL’s earnings.
The data shows a generally positive relationship between earnings and cash flow, particularly in 2022 and 2024 where CFO exceeded net income, a sign of high-quality earnings. However, the negative CFO in 2023, despite positive net income, suggests a significant cash drain from working capital, likely related to the timing of accrued liabilities or a build-up in receivables.
United Airlines (UAL) Quarterly Net Income and Cash from Operating Activities (2020-2024)
4.4.1 Free Cash Flow Trend
The free cash flow (FCF) trend further illustrates the capital-intensive nature of UAL’s business. The negative FCF in most quarters underscores the airline’s heavy investment in fleet modernization and expansion, which is critical for maintaining competitive advantage but also places pressure on liquidity. The consistent negative FCF (except for 2024) highlights its intense capital expenditure cycle, making sustained operational cash generation essential to fund its growth ambitions.
United Airlines (UAL) Quarterly Free Cash Flow (2020-2024)
4.5 Efficiency and Performance Ratios
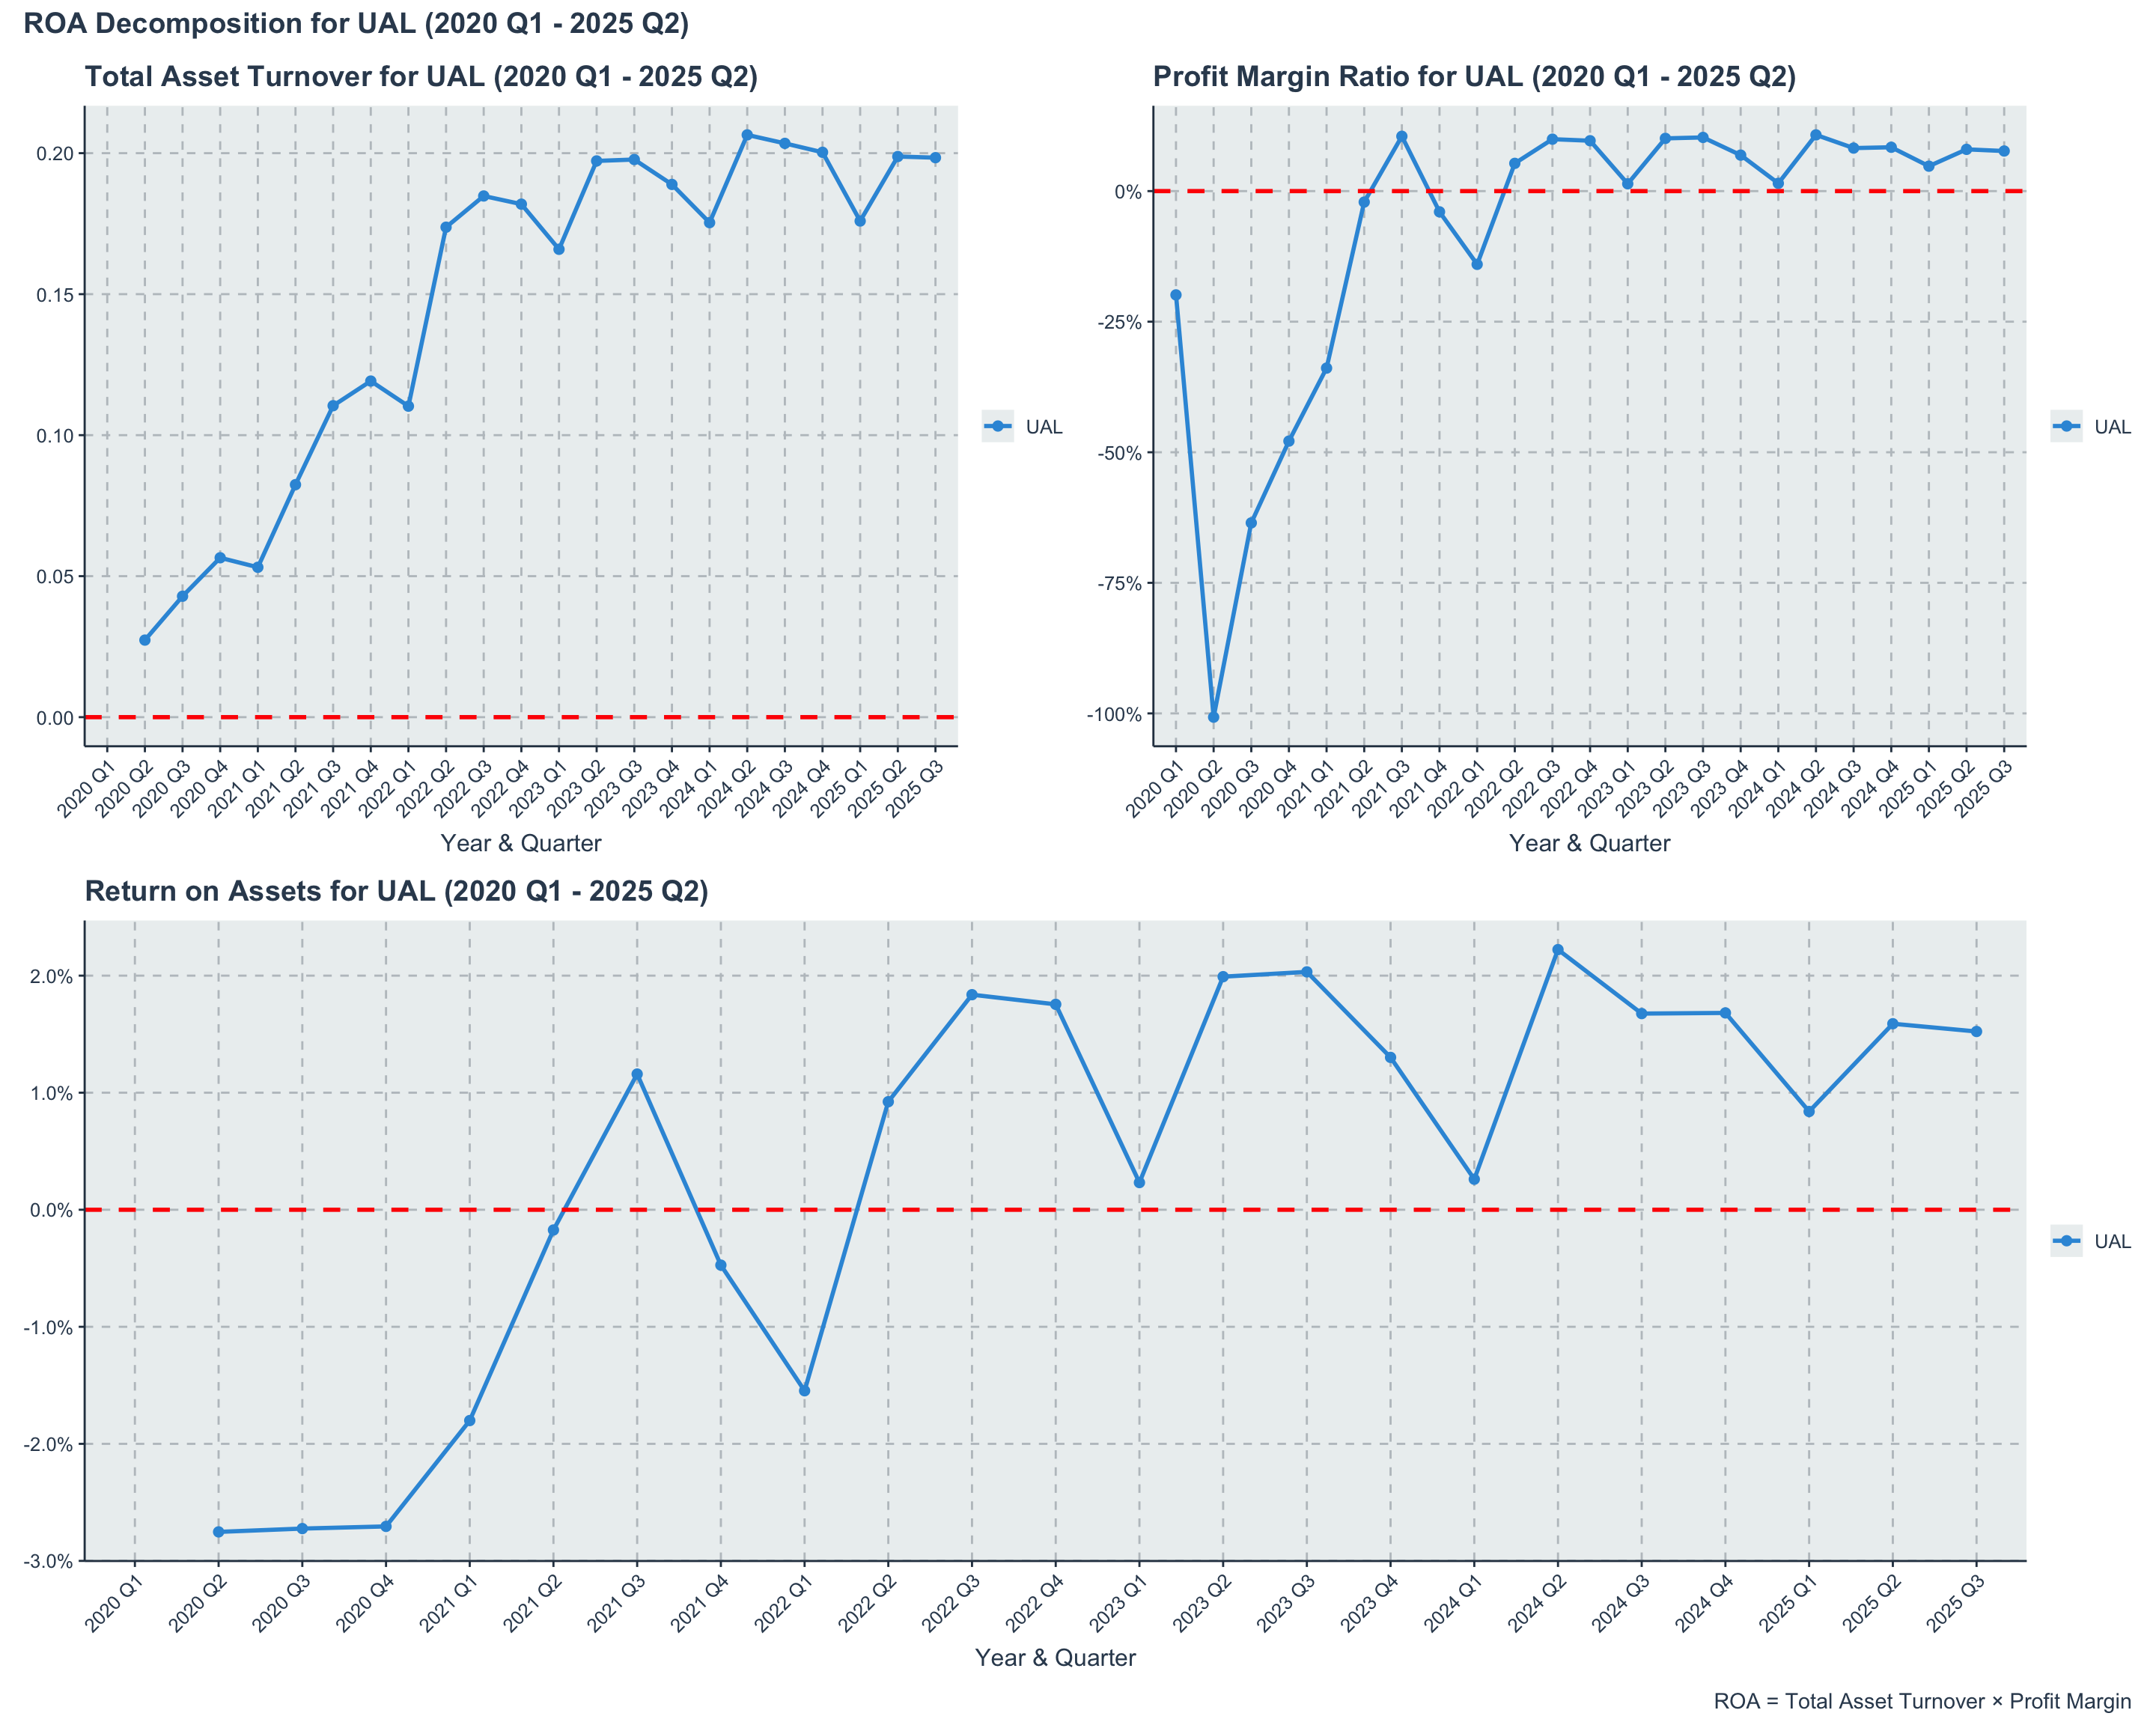
UAL’s Return on Assets (ROA) trajectory highlights the airline’s efficiency in utilizing its asset base to generate profits. The negative ROA during the pandemic years reflects the severe operational challenges faced, while the positive rebound in 2022 and beyond indicates improved asset utilization as travel demand recovered.
United Airlines (UAL) Quarterly Return on Assets (ROA) (2020-2024)
ROA decomposition illustrates how UAL’s asset efficiency and profitability jointly influence its overall return on assets. The interplay between these two components highlights the airline’s strategic focus on maximizing both revenue generation and cost management to enhance asset returns.
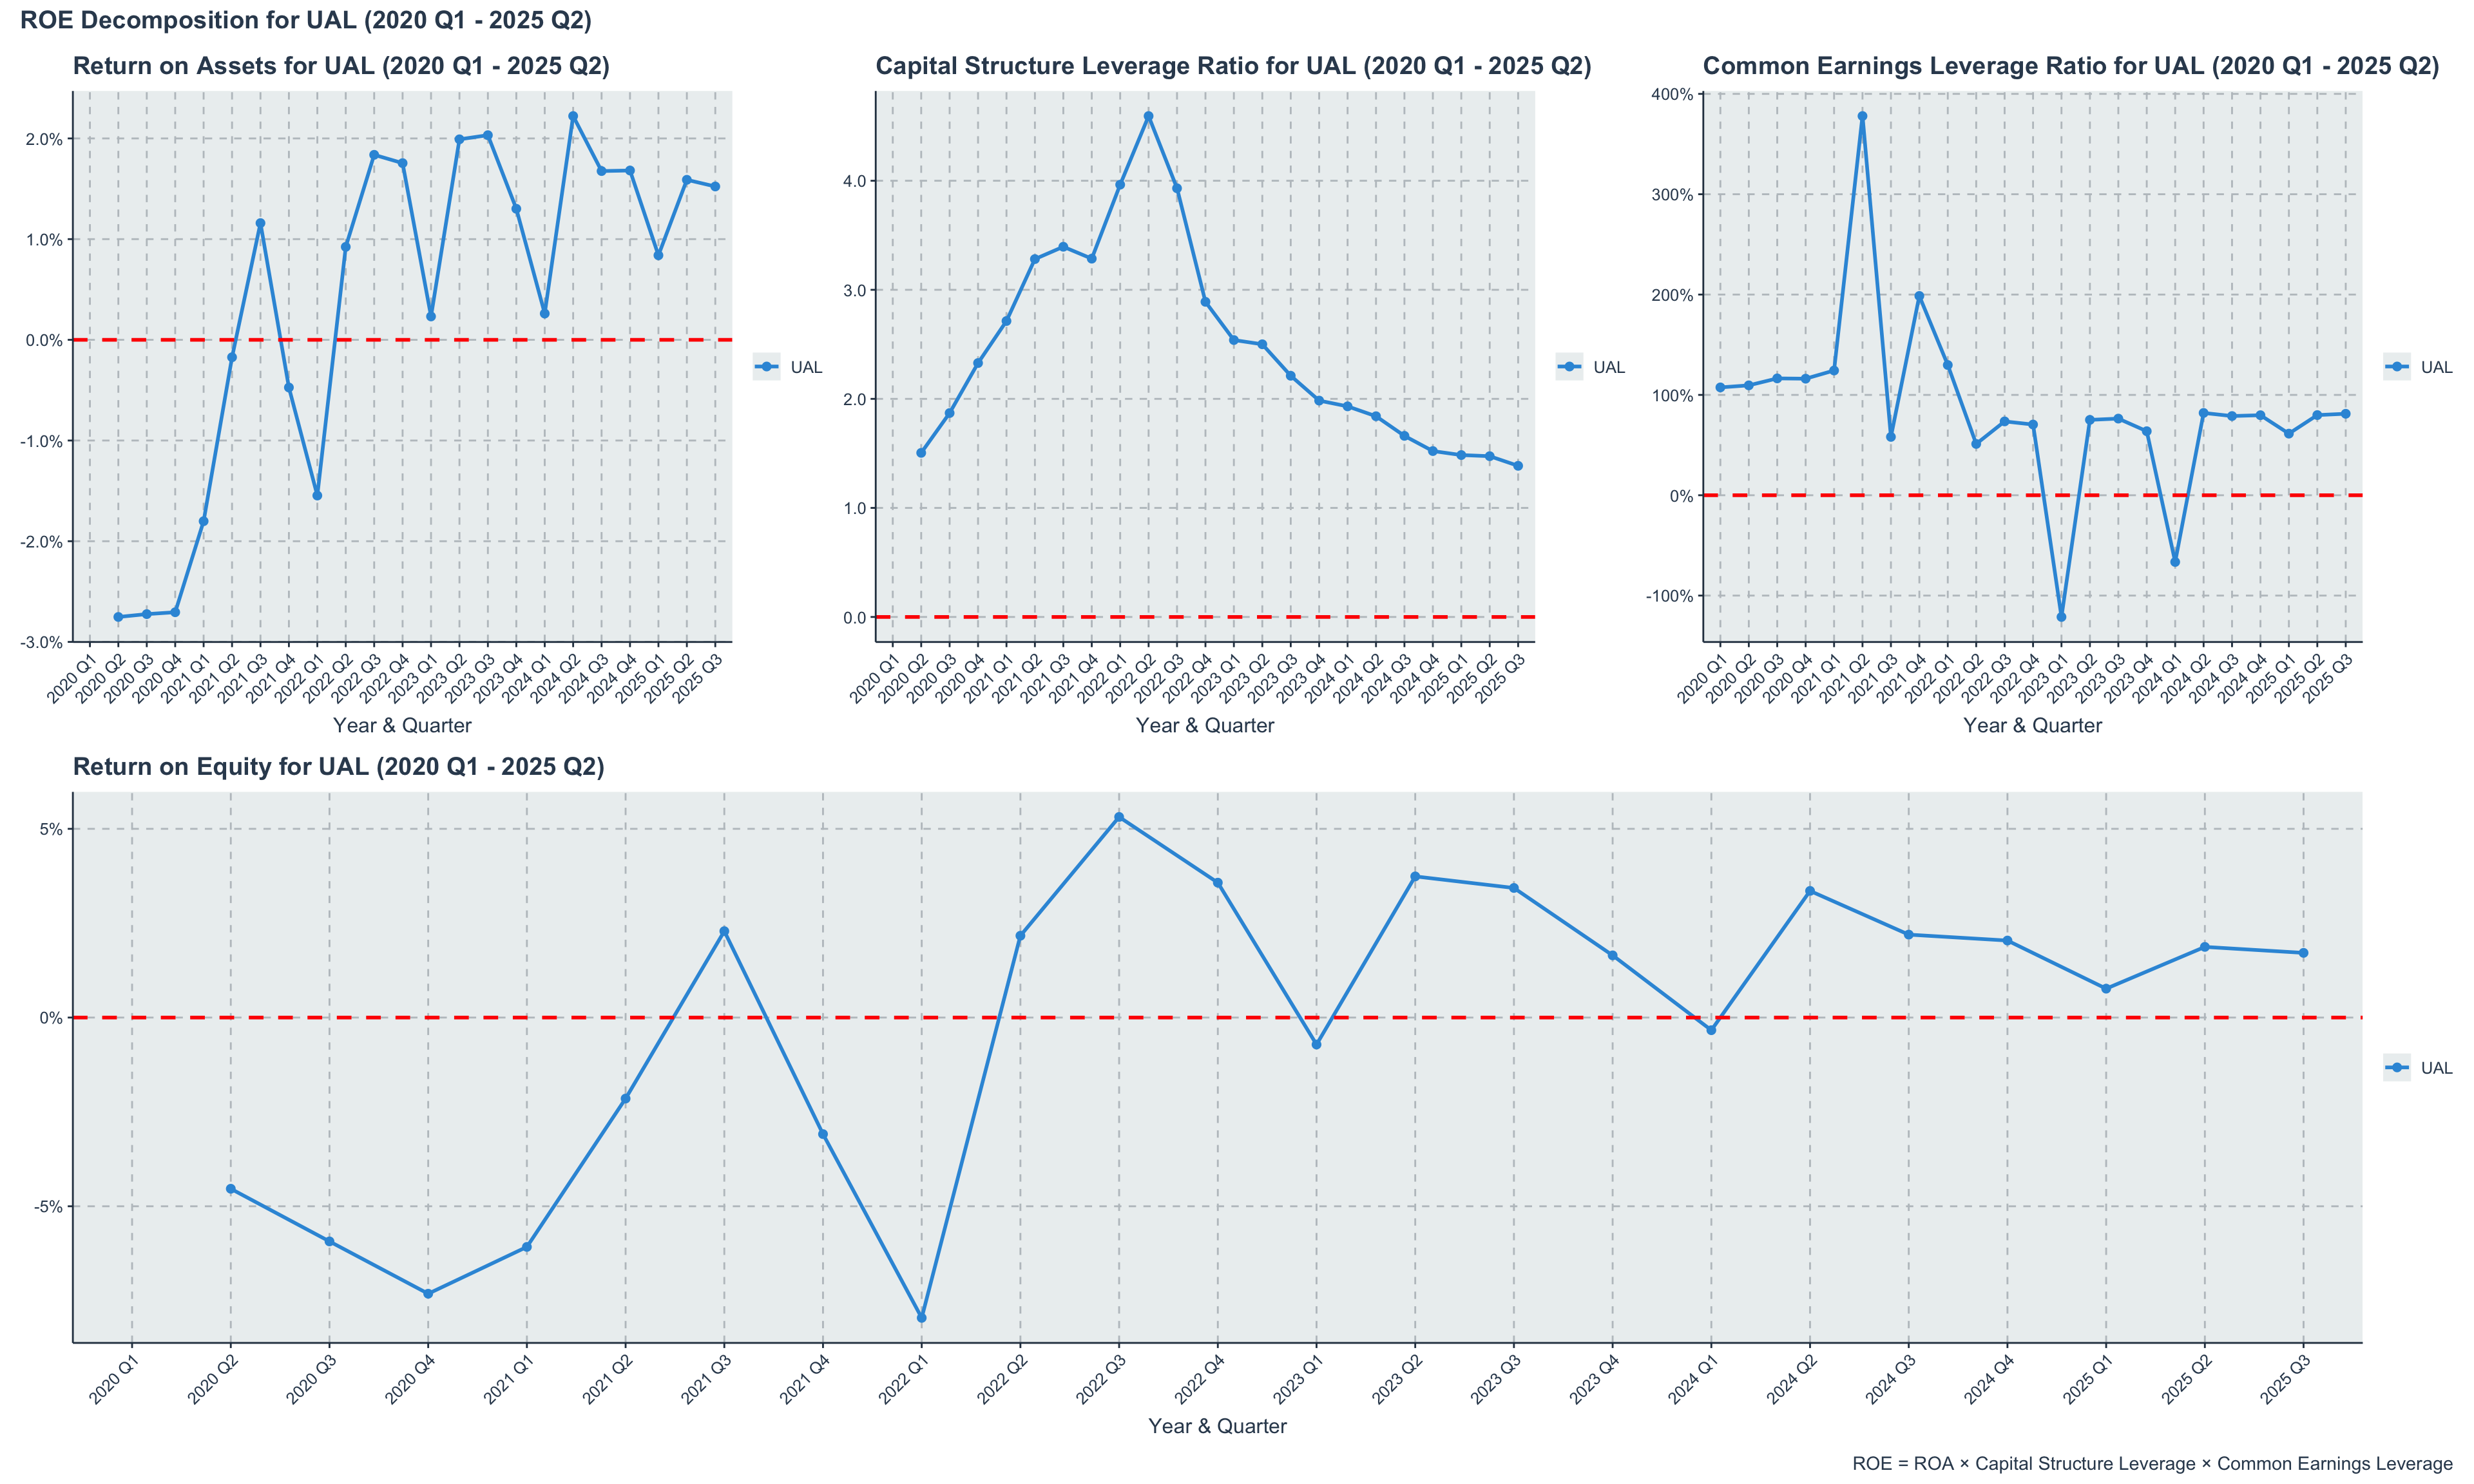
UAL’s Return on Equity (ROE) pattern closely follows that of ROA, underscoring the airline’s ability to generate shareholder returns from its equity base. The significant dip during the pandemic years is indicative of the financial strain experienced, while the recovery in subsequent years reflects improved profitability and effective equity utilization.
United Airlines (UAL) Quarterly Return on Equity (ROE) (2020-2024)
Decomposing ROE into its constituent parts provides a nuanced understanding of how UAL generates returns for its shareholders. The interaction between operational efficiency (ROA), financial leverage (Capital Structure Leverage), and earnings quality (Common Earnings Leverage) reveals the multifaceted approach UAL employs to enhance shareholder value.
4.6 Summary
In summary, United Airlines has demonstrated a robust recovery from the pandemic-induced downturn, marked by a strong rebound in revenue and a return to profitability. The airline’s strategic focus on premium travel segments has paid off, enabling it to achieve healthy operating margins. However, the balance sheet remains highly leveraged, and the capital-intensive nature of the business continues to pressure free cash flow. Moving forward, UAL’s ability to sustain operational cash generation while managing its debt levels will be critical to its long-term financial health and competitive positioning in the evolving airline industry.